
 Moisture Determination by Improved On-Site Diagnostics (Part 2)
Author: Maik Koch and Michael Krueger – Omicron Electronics Austria
Analysis of Dielectric Measurements
Interpretation in Frequency Domain
Dielectric diagnostic methods deduce moisture in paper or pressboard from dielectric properties like polarisation and depolarisation currents, complex capacitance and dissipation factor. Moisture strongly influences these quantities. The dissipation factor plotted via frequency shows a typical s-shaped curve. With increasing moisture content, temperature or aging the curve shifts towards higher frequencies. Moisture influences the low and the high frequency parts. The middle part of the curve with the steep gradient reflects oil conductivity. Insulation geometry conditions determine the “hump” left of the steep gradient. In order to determine the moisture content of the insulation, the measurement should also provide data left of the “hump”, where the properties of the solid insulation dominate.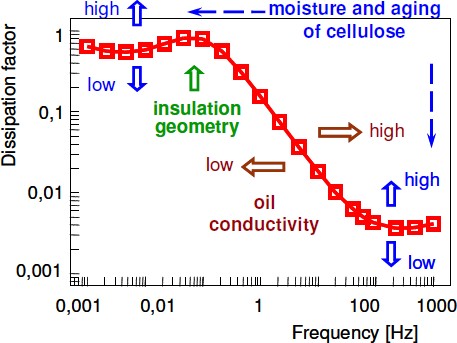
Figure 4. Interpretation scheme for FDS providing discrimination between the influences of moisture, aging, oil conductivity and insulation geometry
Moisture Analysis
Moisture determination bases on a comparison of the transformers dielectric response to a modelled dielectric response. A fitting algorithm rearranges the modelled dielectric response and delivers moisture content and oil conductivity. A reliable moisture analysis of onsite measurements bases on an exact data pool for the modeled dielectric response. The data pool constitutes of measurements on new pressboard at various temperatures, moisture contents and oils used for impregnation [8]. The dielectric properties of aged pressboard were investigated as well in order to compensate for the influence of aging. To ensure the reliability of the achieved data base the results were compared to previous investigations, e.g. [9]. In the moisture analysis algorithm at first the insulation temperature T from the measured dielectric response C(f) is taken and the corresponding permittivity record ‹PB(f) from the extra- and interpolated data base. The so called XY-model combines this permittivity record ‹PB(f) with the complex oil permittivity ‹Oil(f). The XY-model allows for the computation of the dielectric response of a linear multi-layer-dielectric [10], where X represents the ratio of barriers to oil and Y the ratio of spacers to oil. The obtained modelled permittivity sm(f) = stot(f) is converted into a modelled capacitance Cm(f) and then compared to the measured dielectric response C(f). The modelled capacitance Cm(f) with the best fitting to the measured capacitance C(f) gives the moisture content in cellulose and the oil conductivity of the real transformer. Figure 5 (left) depicts the programming flowchart of the new analysis algorithm.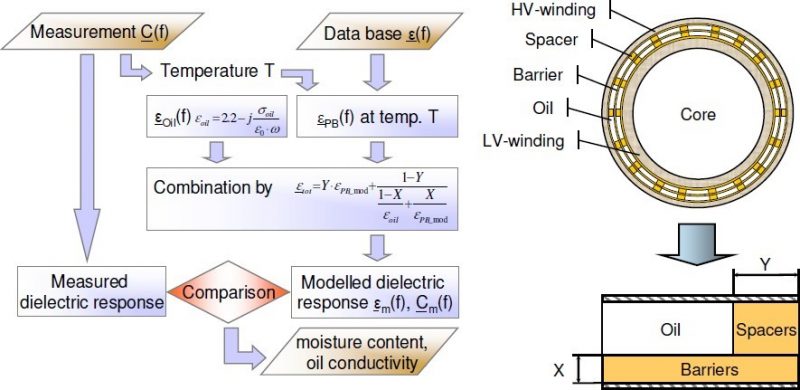
Figure 5. Left: programming flowchart of the analysis algorithm Right: representation of a cylindrical transformer insulation by the XY-model
Consideration of Conductive Aging Byproducts
Aging of cellulose and oil causes conductive by-products as carboxylic acids. These acids are deposited in the solid insulation and dissolved in oil. Their DC-conductivity increases the losses and thus “imitates” water.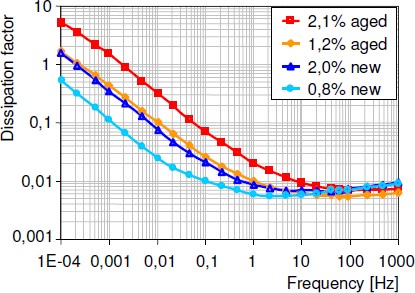
Figure 6. Dissipation factor for new and aged pressboard samples having similar moisture contents measured at 20°C insulation temperature
Moisture Measurement through Moisture Equilibrium
Moisture Equilibrium
Moisture equilibrium bases on three conditions: thermal equilibrium (temperature), mechanical equilibrium (e.g. pressure) and chemical equilibrium. Thermodynamic equilibrium is reached, if the macroscopic observables do not change with time and place. An equilibrium regarding the time aspect is possible during a constant load period of a transformer. Still the observables will change with place. Equilibrium for time and place can be reached only in locally limited areas, e.g. between cellulose and the surrounding oil at high temperatures and slow oil flows. Moisture equilibrium means, that the no migration of water molecules inside materials and between oil and cellulose occurs. Moisture migrates until the water vapour pressure p gains the same value, thus differences in the moisture vapour pressure are the driving force for moisture migration, (2).p (Cellulose) =p (Oil) =p (Air) (2)
Supposed the same temperature and pressure rules, moisture exchange can be described in terms of relative saturation. The moisture content relative to saturation level in adjacent materials becomes equal (3). The material might be cellulose, oil, air or even a plastic.RS (Cellulose) =RS (Oil) =RH (Air) (3)
Conventional Equilibrium Diagrams
It is a standard procedure for operators of power transformers to derive the moisture by weight (%) in cellulose from the moisture by weight in oil (ppm). This approach consists of three steps: (1) Sampling of oil under service conditions, (2) Measurement of water content by Karl Fischer Titration and (3) Deriving moisture content in paper via equilibrium diagrams (e.g. [14]) from moisture in oil. Unfortunately crucial errors effect this procedure:- Sampling, transportation to the laboratory and moisture measurement by Karl Fischer titration,
- Equilibrium conditions are rarely achieved (depending on temperature after hours/days/months),
- A steep gradient and high uncertainty in the low moisture region compounds the accuracy,
- Diagrams from various literature sources lead to different results,
- The temperature gradient in windings (up to 30 K) causes a uneven moisture distribution,
- Equilibrium depends on moisture solubility in oil and moisture adsorption capacity of cellulose.
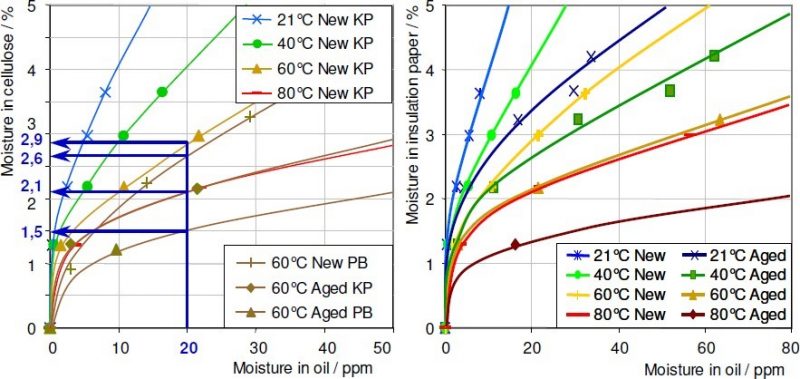
Figure 7. Left: equilibrium diagram for moisture in Kraft paper KP and oil with additional graphs for new pressboard PB and aged kraft paper and pressboard
Right: equilibrium diagrams adapted to the moisture adsorption capacity of new Kraft paper in new oil and of thermally degraded Kraft paper in aged oil
Diagrams Adapted to the Moisture Adsorption Capacity
The first step to improve equilibrium diagrams is to adapt them to the water adsorption capacity of the materials involved [3]. Diagrams as Figure 7 (right) might be used to determine the “true” water content in cellulose, since they are adapted to the moisture adsorption capacity of the materials. They still have the essential drawback, that their validity is restricted to the involved materials. For other materials and ageing conditions they have to be redrawn, that is, a correction is necessary for every transformer with its special materials and aging conditions. Because of this disadvantage the following subsection describes the next step to more universal equilibrium diagramsMeasurement via Moisture Saturation of Oil
In this approach instead of moisture in oil relative to weight (ppm) the relative saturation in oil (%) is used. Additionally the diagrams are adapted to the moisture adsorption capacity of the cellulose. Based on equation (3) via moisture adsorption isotherms the moisture content in cellulose is derived from moisture relative to saturation of the surrounding oil. The advantages are:- Oil aging and its influence on moisture saturation level becomes negligible, since it is already included into the measurement of moisture
- With relative moisture on the X-axis the graphs become less temperature dependent compared to moisture by weight on this axis (Figure 8, right)
- Errors due to sampling, transportation to the lab and titration are excluded.
- Continual, accurate measurement and easy implementation into a monitoring systems
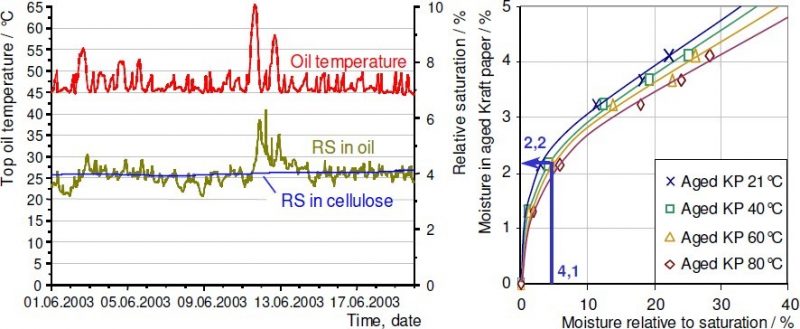
Figure 8. Left: top oil temperature, relative saturation in oil and in cellulose measured resp. calculated by an online monitoring system
Right: determination of water content in thermally degraded Kraft paper via a moisture adsorption isotherm
- Neither oil nor paper aging effects the validity
- Conversion via equilibrium charts unnecessary
- Direct relation to the destructive impacts of water
- Continual, accurate measurement and easy implementation into a monitoring systems